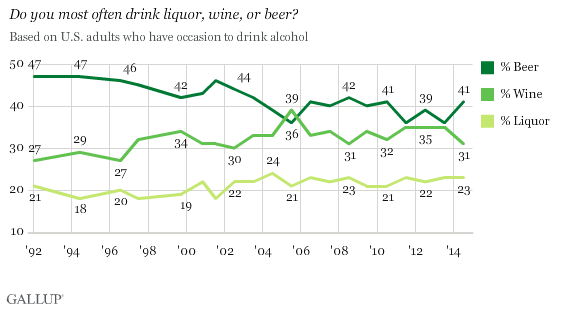
When we want some serious statistics, we turn to the folks over at Gallup. They always conduct great studies and polls and then share the interesting results with the public. In fact, they released some data last week that takes a closer look at how and what Americans are drinking right now when it comes to alcohol. What did they discover? We thought you’d never ask!
- Beer wins as our drink of choice, as it has for most of the past two decades. 41% of Americans say they prefer beer, while 31% opt for wine and 23% lean toward liquor.
- Sixty-five percent of adults who are legally allowed to drink say that they do so.
- Out of the 65 percent of adults who drink, 67 percent said they had at least one drink in the past week. 25 percent said they drank in the last three months, and 10 percent said it had been quite a while (a lot of these people are the ones who only drink during special occasions).
- Most Americans are drinking on the weekends rather than the week days (duh).
- Out of all the people who said they drink, Gallup asked them how many drinks they’d had in the past seven days. The average came out to 4.1 drinks/week, which is pretty average for the last few years. This average included the 35 percent of people who did not drink in the past week, so that number was increased quite a bit by the 9 percent of people who had between eight and 19 drinks, and the 5 percent who had 20 or more.
A lot of the statistics that Gallup provided were pretty consistent with the past few years. The most interesting chart to watch is the one that plots how often people drink liquor, wine, and beer because although it is also consistent, it can randomly surprise you as well. For example, beer had a major lead in the 1990s, but between 2002 and 2006, it took a huge nose dive – and then started trending upwards again. With the craft beer boom going on currently we don’t see beer dropping like that again any time soon, but we’re watching liquor; the smaller batch craft distilleries may give the category the boost it needs.


