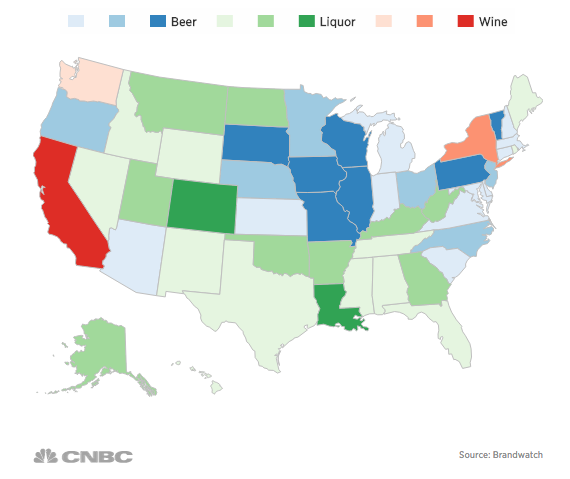
 While throwing a few back at the weekly happy hour or during a long weekend full of day drinking, many of us tend to jump on social media and share what a great time we are having drinking with co-workers, friends and family on the Twittersphere. Social media intelligence company, Brandwatch, has caught on quickly and decided to take advantage of all the tweets aka “data” floating around the social media universe, putting them to good use!
Millions of tweets from locations all around the county have been mined from the beginning of 2015 to give us better insight into which type of alcohol is favored in specific states and regions. With an interactive map, Brandwatch has organized the data, making it easy to see can see which states prefer beer vs. wine vs. hard liquor. When it comes down to it, American’s are partial to mentioning hard liquor via Twitter, making up almost half of boozy tweets. However, wine was the winner in both California and New York taking over two of the countries highly populated states. Beer held it’s own in the middle of the country, driving conversation among the majority of Midwesterners.
This data is not only cool to peruse through for us booze fanatics, but it also is a big help for liquor companies and restaurant chains looking to map out their distribution and strategic planning. Twitter data has played a large role in helping big businesses understand what their consumers really want, and we have to say we fully stand behind whatever gives us an even better selection of our favorite alcohol. Check out the interactive map here and learn more!

